
About GRAMPA
This section is a brief explanation of the rationale and implementation of the algorithm. For a more in depth explanation, see our paper in Systematic Biology.
For information about the program and its options, see the README
Background
Polyploidy leading to whole genome duplications (WGD; a doubling of the number of chromosomes in an organism) can occur in two ways:
- Autopolyploidy occurs when two individuals from the same species produce an offspring with both sets of chromosomes from each parent intact.
- Allopolyploidy occurs when two individuals from different species hybridize to form a new species with both sets of chromosomes from each parental species.
Many methods that study polyploidy are unable to distinguish between the two modes of polyploidization. In fact, most make an implicit assumption that WGDs are the result of autopolyploidization and can therefore be positively mis-leading about the placement of WGDs on a phylogeny.
One reason prior methods have had trouble with allopolyploidy is that they treat genes resulting from allopolyploidy as paralogs when they actually have similarities to orthologs as well.
- Paralogs are genes found in the same or different species that can trace their most recent common ancestor back to a duplication event.
- Orthologs are genes found in the same species that can trace their most recent common ancestor back to a speciation event.
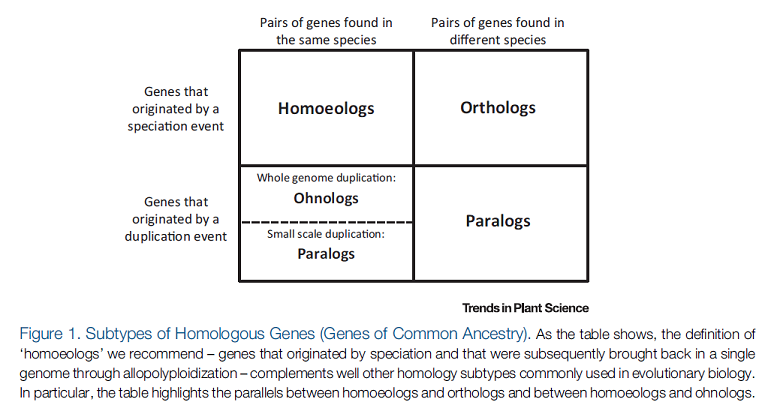
The tricky thing about genes arising from allopolyploidy is that they can be found in the same or different species and yet their most recent common ancestor is a speciation event -- the hybridization of the two parental species resulting in a new hybrid species. Neither of the definitions above fit this scenario. Fortunately, a helpful paper by Glover et al.[1] has clarified some terms for us with respect to WGDs. They add the following two definitions:
- Ohnologs are genes found in the same species that can trace their most recent common ancestor back to a whole genome duplication event (autopolyploidy).
- Homoeoelogs are genes found in the same species that can trace their most recent common ancestor back to a speciation event.
In other words, genes that arise from autopolyploidization are ohnologs, while genes that arise from allopolyploidization are homoeologs. Genes that arise from small scale duplications are paralogs and genes arising from the split of two populations that diverge into two species are orthologs. Glover et al.[1] provide a nice table that sums this up:
So, if we want to be able to accurately identify WGD's and the mode of polyploidization that produced them, we need to take these geneological relationships into account. As it turns out, the best way to do this is to simply change the way we represent our species phylogeny.
MUL-trees
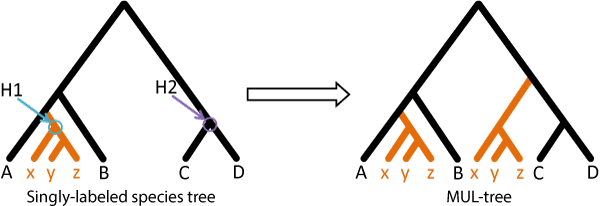
Multi-labeled trees, or MUL-trees, are phylogenies in which the tip labels are not necessarily unique. These turn out to be extremely useful when representing polyploid species because they are essentially showing the relationships of genomes rather than species. Therefore, they can represent both sub-genomes of a polyploid species in a single phylogeny.
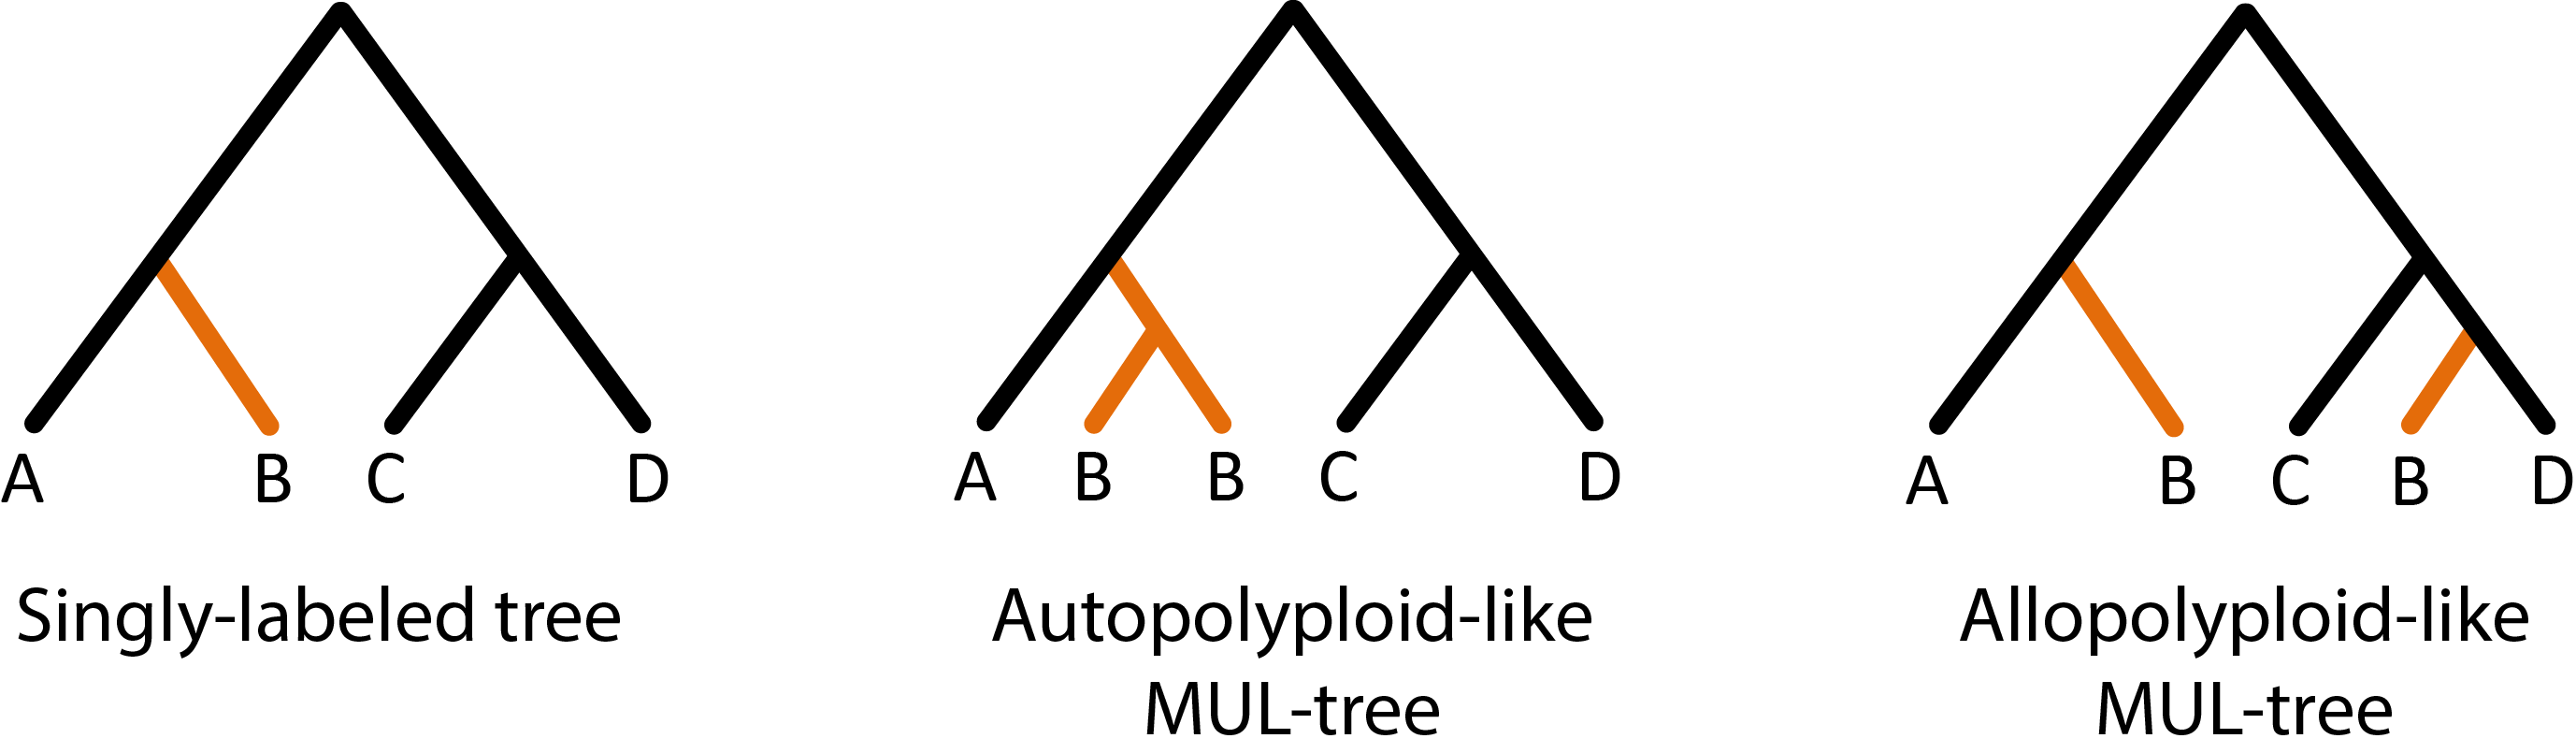
For instance, in the figure above we can see the singly-labeled species representation of these 4 taxa on the left. This representation is the common output of most species tree programs and is fine if no polyploidy has occurred. However, it is insufficient when studying polyploidy. Use of a singly-labeled species phylogeny can lead to the mis-representation of allopolyploids as autopolyploids and inflate the counts of duplications and losses (see our paper for more details). MUL-trees, on the other hand, can represent the genomes of various types of polyploidy events. The middle panel above shows a MUL-tree if taxa B is the result of autopolyploidization. In this case, the two B sub-genomes are sister to one another. The panel on the right shows a MUL-tree if taxa B is the result of hybridization between the A and D lineages (allopolyploidization). The two B sub-genomes are now sister to the parental lineage to which they are most closely related.
Using this genome representation we were able to adapt a popular algorithm for counting gene duplications and losses, LCA reconciliation, to also be used to study polyploids
LCA Gene tree reconciliation
Least common ancestor (LCA) gene tree reconciliation is a method to classify nodes in a gene tree as either speciation or duplication events, given an accepted species phylogeny. It does this by creating a map of each node in the gene tree to a node in the species tree. The procedure for mapping ensures that if a node in the gene tree maps to the same node in the species tree as one of its direct descendant nodes, then that node is a duplication event.
Step 1: Initialize the maps at the tips of the tree
The process begins by simply using the labels in the gene tree to map them to tips in the species tree:
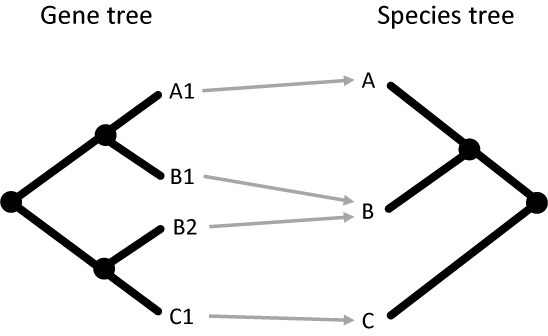
In this simple example, the genes A1, B1, B2, and C1 in the gene tree map to the species A, B, B, and C in the species tree. This is simple because the tip nodes in the gene tree have labels that contain the name of the species from which they came.
Step 2: Map the internal nodes
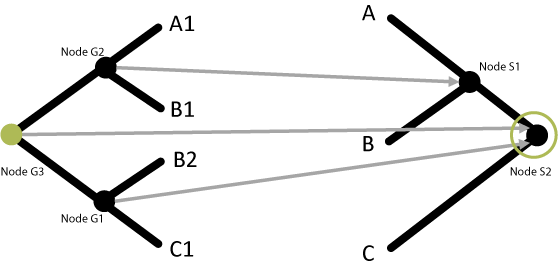
Based on the initial mappings of the tip nodes, the internal nodes can be mapped:
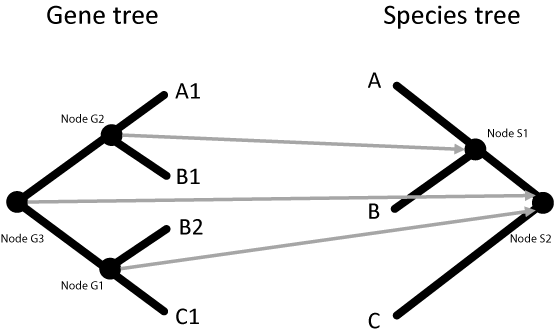
Each internal node is defined by the set of tips below it in the tree. For example, in the gene tree above, Node G1 is defined by tips C1 and B2. These tips map to tips in the species tree C and B, respectively. In the species tree, we observe that the least common ancestor (LCA) of nodes C and B is Node S2. Therefore, we can say that Node G1 in the gene tree maps to Node S1 in the species tree. This process is repeated for every node in the gene tree until all nodes are mapped.
Step 3: Count duplication nodes
Any node in the gene tree that maps to the same node in the species tree as one of its direct descendants is classified as a duplication node:
Node G3 and one of its direct descendants (Node G1) both map to Node S2, therefore Node G3 is a duplication node! The number of duplication nodes are counted to get a duplication score for this gene tree/species tree combination.
Step 4: Counting losses
Durand et al.[2] provided a really simple way to count losses in a gene tree, given a set of maps to a species tree:

So this says that to count losses along any branch in a gene tree (l_bg), you subtract depth (in the species tree) of the map of the node at the end of the branch (M(n_g)) from the depth (in the species tree) of the map of the ancestral node. You then correct for the expected difference (-1) and for the fact that the ancestral node might be a duplication node (IsDup). The total number of losses for all branches can be summed to get a loss score for this gene tree/species tree comination.
Step 5: Aggregating scores
Given a single gene tree and a species tree, we can take the duplication score and loss score and add them up to get a total score for this reconciliation. We can then repeat the procedure for any number of gene trees and sum the scores across gene trees to get a total parsimony score. Reconciling the same set of gene trees to different species topologies can be a way to determine the most parsimonious species tree (e.g. Guigo et al.[3])!
Gene-tree Reconciliation with MUL-trees for Polyploid Analysis
We sought out to adapt the algorithm described above to work accurately in the presence of polyploidy. That means we want to reconcile gene trees to MUL-trees. The main problem we encountered with this adaptation is that we can no longer properly initialize the maps of polyploid genes in the gene tree because they have multiple possible places to map to in the species tree:
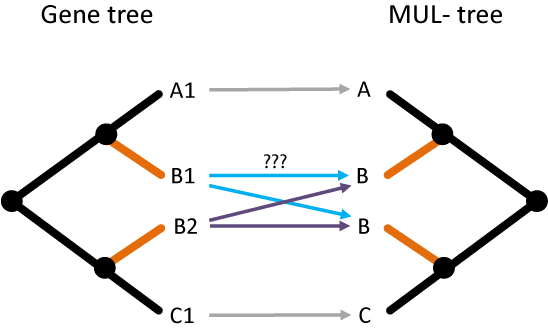
In this case, both B1 and B2 in the gene tree could possibly map to B (sister to A) or B (sister to C) in the MUL-tree! This leads to unresolvable internal maps as well.
The important observation to solving this problem is to notice that the correct initial maps will always lead to the lowest reconciliation score. Working with this observation, we can then try all possible initial maps from this gene tree to the MUL-tree and apply the parsimony principle to the final scores to get the correct map:
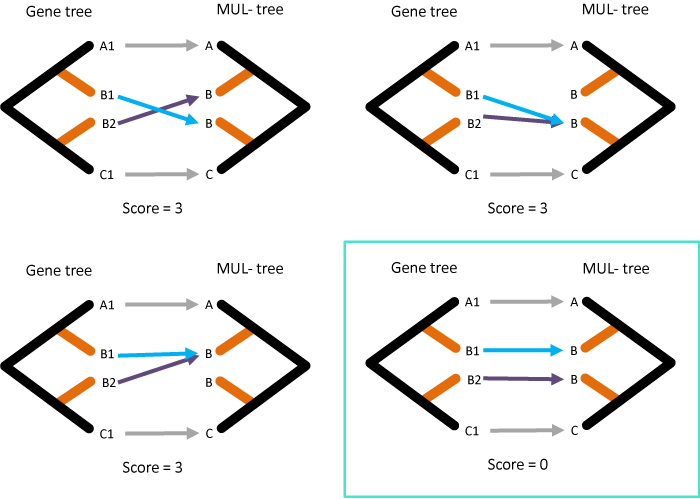
This strategy ensures that we count the correct number of duplications and losses, even in cases of allopolyploidy where genes present in multiple copies within a species might not be due to a duplication event.
Of course, this type of combinatorial algorithm has exponential run time with the number of polyploid genes in the gene tree, so we came up with some ways to speed it up. You can find more info about those heuristics in the paper (Fig. S2).
Using GRAMPA to detect and place a polyploidy event on a phylogeny
Similar to the species tree search done with LCA reconciliation to singly-labeled trees, GRAMPA can test hypotheses of polyploidy by reconciling the same set of gene trees to different MUL-trees. The MUL-tree with the lowest score indicates the polyploid species and their closest surviving parental lineages. GRAMPA can also reconcile and compare to a singly-labeled tree, and if that tree has the lowest score then no polyploidy has occurred. This works because penalties naturally arise when reconciling to the wrong type of tree (see Fig. S7 in our paper).
GRAMPA has an automatic search function so that it will try reconciliations to any number of user-specified MUL-trees. This can be done by using a singly-labeled species tree as input and specifying the nodes from which to build MUL-trees. We designate these nodes H1 and H2.
- The H1 node in the singly-labeled species tree indicates the clade of species that may be the result of a polyploidy event.
- The H2 node in the singly-labeled species tree indicates the second parental lineage of the polyploid species.
A user may specify H1 and H2 nodes. For each H1 node, every specified H2 node will be used to build a MUL-tree. The sub-tree rooted by H1 and the branch that H1 subtends will be copied and placed on the branch subtended by H2:
The set of gene-trees is reconciled to the resultant MUL-tree and a total reconciliation score obtained. Then the process is repeated for other H1 and H2 nodes (e.g. other MUL-trees) and the tree that has the lowest reconciliation score represents the optimal polyploidy scenario and is indicative of the mode of polyploidization, the parental lineages of allopolyploids, and the number of duplications and losses for each gene tree.
References
- Glover NM, Redestig H, and Dessimoz C. 2016. Homoeologs: What are they and how do we infer them? Trends Plant Sci. DOI: 10.1016/j.tplants.2016.02.005
- Durand D, Halldórsson BV, and Vernot B. 2006. A hybrid micro-macro evolutionary approach to gene tree reconstruction. J Comput Biol. DOI: doi:10.1089/cmb.2006.13.320
- Guigo R, Muchnik I, and Smith TF. 1996. Reconstruction of an ancient molecular phylogeny. Mol Phyl Evol. DOI: 10.1006/mpev.1996.0071