
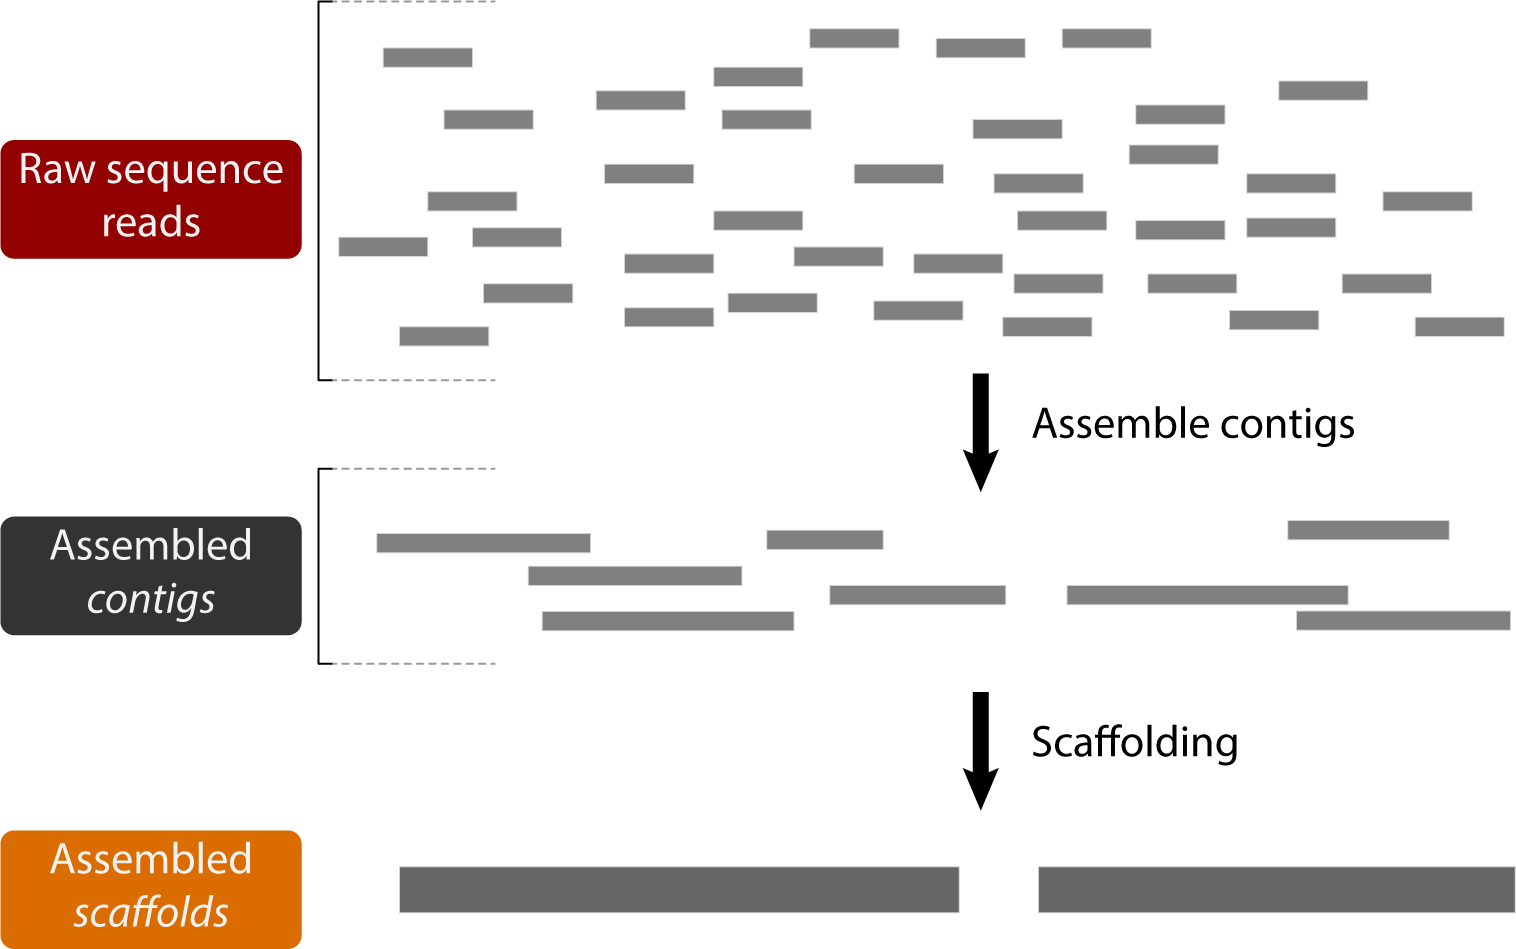
de novo Genome assembly is the process by which overlapping sequence reads are pieced back together to form longer, contiguous sequences for analysis:
Many factors can play a role in the ultimate success of a genome assembly, including sequencing error rate, heterozygosity of the target genome, length of the target genome, and number and length of reads sequenced.
Today, we'll be using both short reads to assemble the D. pseudoobscura genome and then using several metrics to compare several assemblies.
SPAdes is a de Bruijn graph based assembler that can handle many types of data, both short and long reads, and can scaffold contigs together using read pairs or pre-assembled contigs. It is highly automated, and combines results from graphs built from multiple values of k. SPAdes, while relatively fast among genome assemblers, still takes a while to run, so today we'll be running one assembly of D. pseudoobscura on short reads only and compare it to a pre-made assembly that uses both long and short reads.
Let's start by generating the short read assembly:
spades.py -1 dpse-chr2-reads/illumina-subsample/chr2-1mil_1.fastq.gz -2 dpse-chr2-reads/illumina-subsample/chr2-1mil_2.fastq.gz -k 77 -o assemblies/spades-illumina-chr2-k77 -t 4 --isolate| Command line parameter | Description |
|---|---|
| spades.py | Call the main SPAdes interface script. |
| -1 dpse-chr2-reads/illumina/chr2-1mil_1.fastq.gz | The path to the first read-pair file. |
| -2 dpse-chr2-reads/illumina/chr2-1mil_2.fastq.gz | The path to the second read-pair file. |
| -k 77 | The k-mer value. The length of sub-string overlaps used to construct the de Bruijn graph. |
| -o assemblies/spades-illumina-chr2-k77 | The path to the desired output directory. |
| -t 4 | The number of threads SPAdes can use. The default value is 16, but since there are 4 of us to a server we'll limit it to 4. |
| --isolate | --isolate |
This will build the SPAdes assembly from the Illumina short reads. It should take about 4 minutes to run.
SPAdes creates many output files within the specified output directory. Normally, this would include assemblies for multiple k-values.
The final assembly would be constructed by comparing portions of each of the k-mer graphs and selecting the most resolved regions. However,
due to time constraints, we have limited spades to one value of k=77.
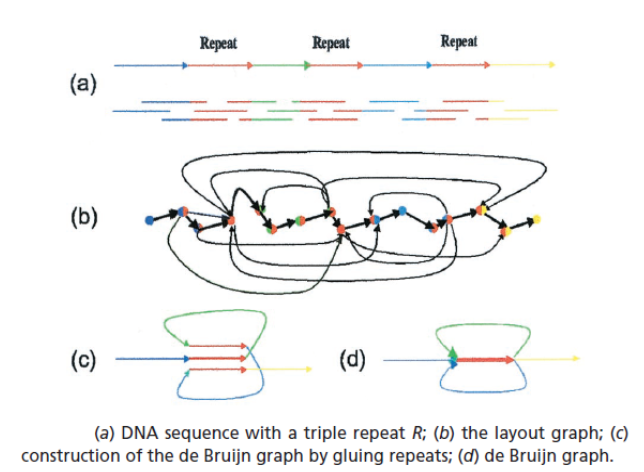
Recall that k is the length of the sub-strings used to construct the de Bruijn graph. Reads a broken up into all possible strings of length k. Counterintuitively, this actually leads to smaller graphs than the overlap graphs, which use full reads, because in the de Bruijn graph, identical overlaps (repeats) are collapsed into a single node:
Selection of k is critical. A k that is too low will mean your graph will have too many collapsed repeats and be unresolvable. Imagine a k=2, which would essentially be a graph made up of the 4 nucleotides looping back on themselves. On the other hand, a k that is too high could lead to graphs with too few overlaps, making the assembly of longer contigs impossible. Fortunately, most modern assembly algorithms (including SPAdes) optimize over many values of k, obviating the need for k-mer selection by the user.
Take a look at this nice visualization of how k affects assembly graph structure. Visualizations done using Bandage.
The final assembly for this run will be in the file assemblies/spades-illumina-chr2-k77/scaffolds.fasta
One of the main goals for a genome assembly program is to produce assembly scaffolds approaching chromosome length. This is difficult because repeats can often form unresolvable portions of the underlying assembly graph that prevent the extension of a sequence. This means genome assemblies can be highly fragmented.
Here are some important statistics to consider when assessing a fragmented assembly:
| Statistic | Description |
|---|---|
Total assembly size | The sum of the length of all contigs. If you have an expected genome size from a closely related organism or other analysis, this can help determine how much of the genome you have assembled. |
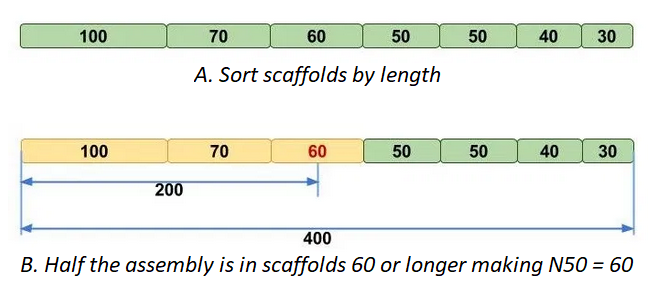
N50 | The length, N, of the scaffold/contig such that 50% of the assembly is contained in scaffolds of length N and longer. In other words, at least half of the nucleotides in the assembly belongs to contigs with the N50 length or longer. |
L90 | The number of scaffolds that make up 90% of the assembly. Ideally close to the number of chromosomes in the sequenced organism. |
Number of Ns | Bases that can't be confidently called, especially near contig junctions within scaffolds, are represented by Ns in the FASTA assembly file. Counting the total number of Ns can give you an idea of how well contigs were joined together into scaffolds. |
N50 can be a little tricky to understand, luckily the Molecular Ecologist blog
has a simple explainer post, that has the following figure:
L90 is similar, but using number of scaffolds instead of scaffold length.
These statistics are relatively easy to calculate, but there are also tools that can summarize these and more for a given assembly. Assemblathon was a competition to assess genome assemblers in 2013. They have helpfully made available some of the scripts they use to quantify final genome assemblies in their github repository. We will use one of their scripts to gather some basic statistics about a genome assembly.
Instead of using the assembly we just produced, which is only of a single chromosome, we've provided several D. pseudoobscura genomes to compare in the
expected-outputs/assemblies/ folder. Let's run the assemblathon script on one of them:
perl /usr/bin/assemblathon_stats.pl expected-outputs/assemblies/spades-illumina-only.fasta > assemblies/spades-illumina-only-assemblathon.txt| Command line parameter | Description |
|---|---|
| perl | Invoke perl to run a script. |
| /usr/bin/assemblathon_stats.pl | The path to the perl script to run. |
| expected-outputs/assemblies/illumina-only-spades.fasta | The input FASTA file containing a genome assembly. |
| > | This redirects the output from the command specified before it into the file specified after it. |
| assemblies/spades-illumina-only-assemblathon.txt | The desired output file. |
This should produce the file assemblies/spades-illumina-only-assemblathon.txt which contains several statistics about the assembly
Let's take a look at this file:
less -S assemblies/spades-illumina-only-assemblathon.txt| Command line parameter | Description |
|---|---|
| less | A Linux text file viewer
(use <up arrow> and <down arrow> to scroll up and down by one line
or <space> and b
to scroll up and down by one page, resepectively. Type q to exit) |
| -S | Turn off line-wrapping within less
(use the <left arrow> and <right arrow> to scroll left and right). |
| assemblies/spades-illumina-only-assemblathon.txt | The path to the file you want to view |
This should display a nice table of statstics:
---------------- Information for assembly 'assemblies/illumina-only-spades.fasta' ----------------


                                         Number of scaffolds     133829
                                     Total size of scaffolds  159563605
                                            Longest scaffold     656252
                                           Shortest scaffold         78
                                 Number of scaffolds > 1K nt       7924   5.9%
                                Number of scaffolds > 10K nt       2178   1.6%
                               Number of scaffolds > 100K nt        357   0.3%
                                 Number of scaffolds > 1M nt          0   0.0%
                                Number of scaffolds > 10M nt          0   0.0%
                                          Mean scaffold size       1192
                                        Median scaffold size        109
                                         N50 scaffold length      65232
                                          L50 scaffold count        626
                                                 scaffold %A      27.22
                                                 scaffold %C      22.57
                                                 scaffold %G      22.66
                                                 scaffold %T      27.43
                                                 scaffold %N       0.12
                                         scaffold %non-ACGTN       0.00
                             Number of scaffold non-ACGTN nt          0
We know that D. pseudoobscura has a genome size of roughly 150Mb in 6 chromosomes. So the assembly size of 159563605
is about right, but we've only been able to resolve 133829 scaffolds. No where near the 6 chromosomes we would ideally want.
Such a fragmented assembly could make annotation difficult with genes likely being split between scaffolds, and analysis of structural variation impossible.
What about some other assemblies? We've provided several more assemblies of D. pseudoobscura in the expected-outputs/assemblies/ folder,
including a SPAdes assembly with long reads (PacBio + Nanopore), a Flye
assembly with just PacBio reads and a Flye assembly with just Nanopore reads. The assemblathon output files are there as well, but the statistics we've talked about
are summarized in the following table, as well as the latest published D. pseudoobscura genome on the SRA:
| Statistic | SRA assembly (PacBio/Canu) | SPAdes (Illumina only) | SPAdes (PacBio+Nanopore) | Flye (PacBio) | Flye (Nanopore) |
|---|---|---|---|---|---|
| Number of scaffolds | 70 | 133829 | 122980 | 239 | 1321 |
| Assembly size | 163282969 | 159563605 | 159513481 | 158355727 | 151695649 |
| Scaffold N50 | 32422566 | 65232 | 110786 | 17300572 | 5886457 |
| L90 | NA | 12954 | 7018 | 15 | 70 |
| % Ns | NA | 0.12 | 0.05 | 0.00 | 0.00 |
Clearly the long read assemblies with the long read assembler (Flye) have higher N50s and fewer scaffolds than the SPAdes assemblies. Note that this doesn't mean SPAdes is "worse" than Flye, it just means that for this type of data Flye is producing more contiguous assemblies. Also note that none of these assemblies alone produce scaffolds approaching the SRA assembly for D. pseudoobscura (PacBio/Canu), which has only 70 scaffolds, most assigned to one of the 6 chromosomes.
BUSCO, short for Benchmarking sets of Universal Single-Copy Orthologs, can help to assess the completeness of your genome with respect to gene content. It does so by comparing gene sequences of well annotated species closely related to your species of interest to determine the number of Complete, Duplicated, Fragmented, and Missing genes present in an assembly among a set of universal orthologs.
You'll learn more about BUSCO in the next session, but for now we'll just take a look at a sample output from our SPAdes assemblies.
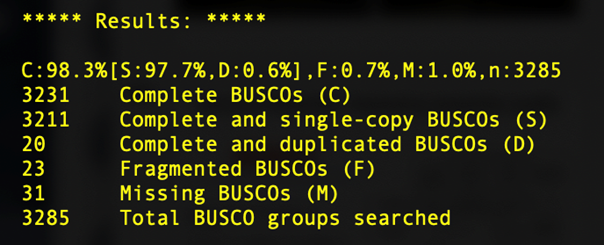
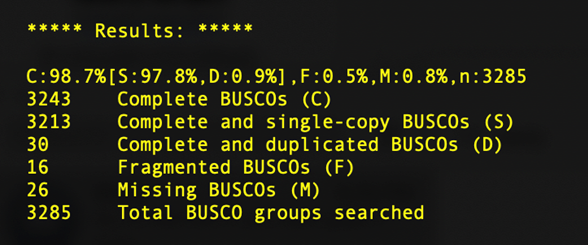
What we can see here is that, despite the short read assembly being much more fragmented, we still recover 98% of the universal copy orthologs, identical to the long read alignment. Depending on the questions you are asking, short read assemblies may be sufficient.
Now that we have a FASTA file that contains our genome assembly, and we know roughly how complete it is from a technical (N50) and biological (BUSCO)
perspective, we're ready to use it for analysis. Many downstream analyses require an assembly FASTA to be indexed. There are several types of
indices and I usually make all of them for any assembly I work with. These indices are made with bwa index, and picard CreateSequenceDictionary.
All of these are simple to generate. Today we'll just generate the samtools faidx for our pre-generated SPAdes Illumina assembly:
samtools faidx expected-outputs/assemblies/spades-illumina-only.fasta| Command line parameter | Description |
|---|---|
| samtools | Call the samtools program |
| faidx | Call the faidx sub-program within samtools |
| expected-outputs/assemblies/spades-illumina-only.fasta | The path to the FASTA file to index |
This should run fairly quickly and will produce the file expected-outputs/assemblies/spades-illumina-only.fasta.fai file that we can look at
less -S expected-outputs/assemblies/spades-illumina-only.fasta.fai| Command line parameter | Description |
|---|---|
| less | A Linux text file viewer
(use <up arrow> and <down arrow> to scroll up and down by one line
or <space> and b
to scroll up and down by one page, resepectively. Type q to exit) |
| -S | Turn off line-wrapping within less
(use the <left arrow> and <right arrow> to scroll left and right). |
| expected-outputs/assemblies/spades-illumina-only.fasta.fai | The path to the file you want to view |
NODE_1_length_656252_cov_29.014074      656252  36      60      61
NODE_2_length_575306_cov_27.441711      575306  667262  60      61
NODE_3_length_562891_cov_29.873761      562891  1252193 60      61
NODE_4_length_438072_cov_30.397365      438072  1824502 60      61
NODE_5_length_388373_cov_29.564742      388373  2269912 60      61
NODE_6_length_381978_cov_29.826266      381978  2664794 60      61
NODE_7_length_364204_cov_28.969093      364204  3053175 60      61
NODE_8_length_351331_cov_28.605180      351331  3423486 60      61
NODE_9_length_348425_cov_29.467863      348425  3780709 60      61
NODE_10_length_333664_cov_29.009230     333664  4134979 60      61
NODE_11_length_325795_cov_29.005299     325795  4474242 60      61
NODE_12_length_315498_cov_28.812061     315498  4805504 60      61
NODE_13_length_304746_cov_29.743095     304746  5126298 60      61
NODE_14_length_301147_cov_28.087172     301147  5436161 60      61
NODE_15_length_300141_cov_28.878596     300141  5742365 60      61
NODE_16_length_291038_cov_28.065040     291038  6047546 60      61
NODE_17_length_279739_cov_29.975989     279739  6343472 60      61
NODE_18_length_267631_cov_28.541939     267631  6627911 60      61
NODE_19_length_262557_cov_28.861460     262557  6900040 60      61
.fai files are pretty straightforward. They contain tab-delimited columns with information for one scaffold on each row. Column 1
indicates the scaffold name, Column 2 the length, Column 3 a byte index, Column 4 the number of bases per line, and Column 5 the number of bytes per line
Other indices that we won't generate directly today include the BWA index files, which make it easier to map reads to an assembly:
bwa index assemblies/spades-illumina-only.fasta| Command line parameter | Description |
|---|---|
| bwa | Call the bwa program |
| index | Call the index sub-program within bwa |
| assemblies/spades-illumina-only.fasta | The path to the FASTA file to index |
And the Picard Dictionary file, which used by variant callers such as GATK and other programs:
Picard CreateSequenceDictionary I=assemblies/spades-illumina-only.fasta O=assemblies/spades-illumina-only.dict| Command line parameter | Description |
|---|---|
| picard | Call the picard program |
| CreateSequenceDictionary | Call the CreateSequenceDictionary
sub-program within picard |
| I=assemblies/spades-illumina-only.fasta | The path to the FASTA file |
| O=assemblies/spades-illumina-only.dict | The path to the desired output file |
After you've generated and assessed the quality of your assembly, the next step is usually annotation. This usually means figuring out where repeats are in the assembly and classifying their types, and figuring out where the genes in the assembly are. There are many ways to do this, enough to fill up a separate workshop, so we won't be covering annotation today.