
Now that we're familiar with de novo assembly, let's look at another strategy for genome assembly: reference-guided assembly by read mapping. Using this strategy, the raw reads aren't put back together, but rather aligned to a reference genome:
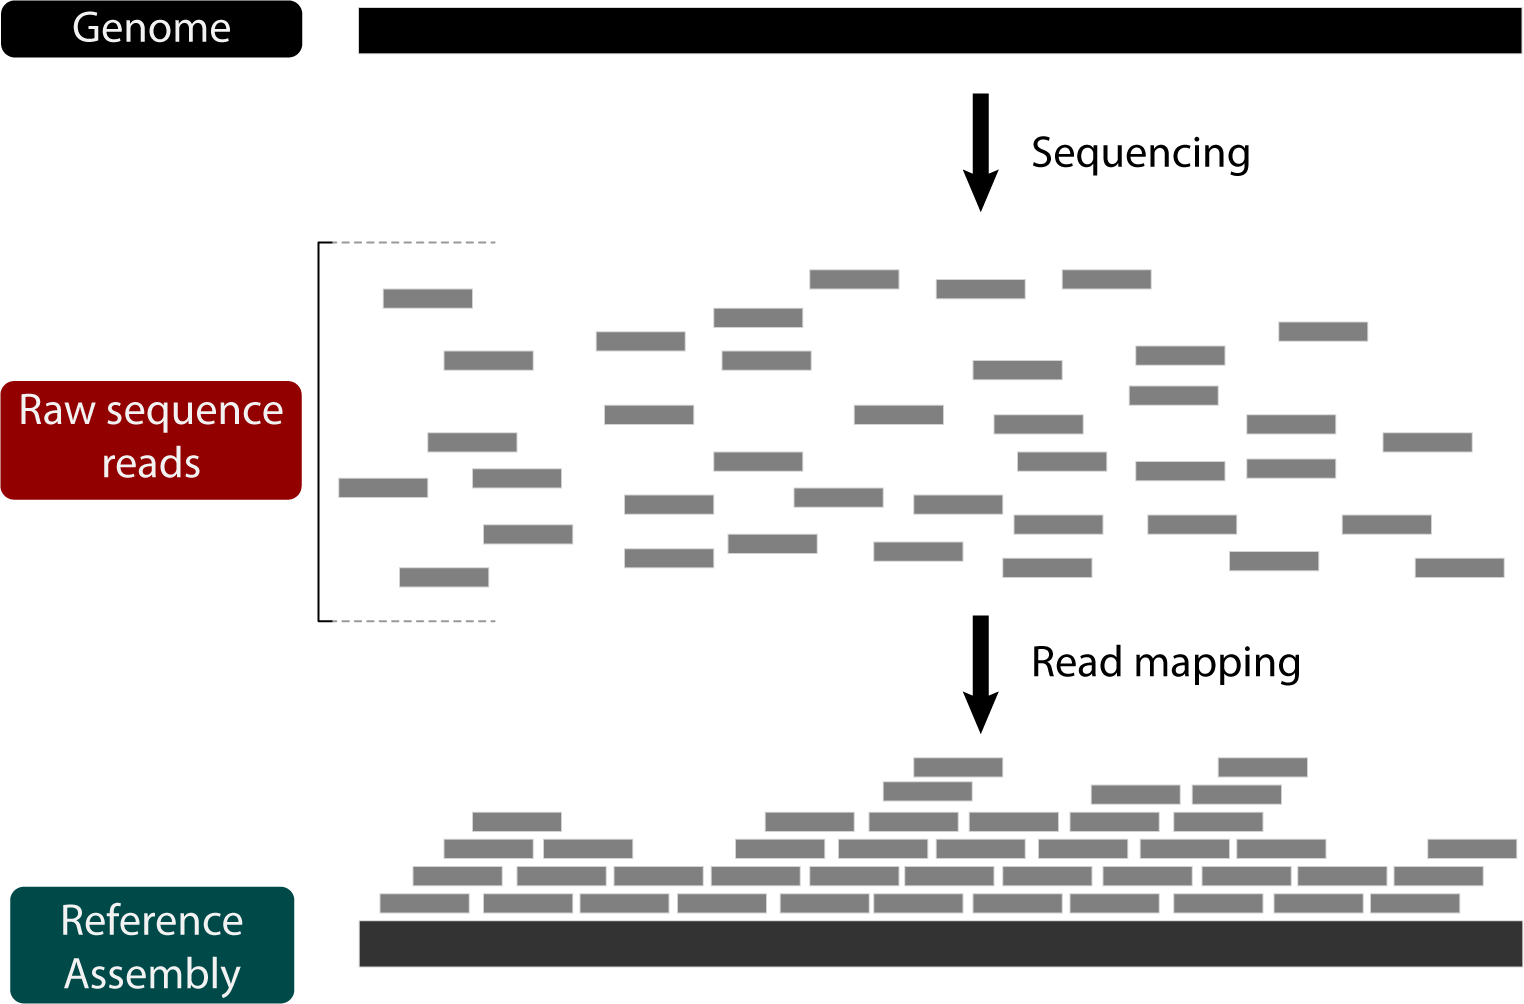
Reference-guided assembly with read mapping has several advantages, including being fast and obviating the need for de novo genome annotation (as long as the reference genome is annotated). On the other hand, read mapping limits the type of mutations that can be inferred. For instance, while structural variation can be indirectly inferred based on relative read-depth, large genome rearrangements between the reference and the sample cannot be captured simply by read mapping. In other words, there's a lot about genome evolution that cannot be answered by mapping reads. Nevertheless, its utility and ease makes it a go-to strategy for systems with good reference genomes.
We'll be using BWA to map some short reads from D. pseudoobscura chromosome 2 to the homologous chromosome 3 in D. melanogaster and then assessing the read mapping.
BWA is a short-read alignment program and is very straightforward. Simply tell it the reads you want to map and the reference genome and it will take care of the rest:
bwa mem -t 4 dmel-3R-reference/Drosophila_melanogaster.BDGP6.28.dna.chromosome.3R.fa dpse-chr2-reads/illumina/pse-chr2_1.fastq.gz dpse-chr2-reads/illumina/pse-chr2_2.fastq.gz | samtools sort > mapped-reads/dpse2-to-dmel3R.bamYou'll notice that in this command we're actually taking the output from BWA and piping it directly into samtools to sort the resulting read
mappings by coordinate. This sorting is required by many programs that process mapped reads.
Here's a table that breaks down this command:
| Command line parameter | Description |
|---|---|
| bwa | Call the BWA program |
| mem | Use the mem alignment algorithm implemented in BWA |
| -t 4 | Tells BWA to use 4 threads to map reads |
| dmel-3R-reference/Drosophila_melanogaster.BDGP6.28.dna.chromosome.3R.fa | The path to the reference genome file |
| dpse-chr2-reads/illumina/pse-chr2_1.fastq.gz | The path to the FASTQ file containin the first pairs of reads |
| dpse-chr2-reads/illumina/pse-chr2_2.fastq.gz | The path to the FASTQ file containin the second pairs of reads |
| | | This pipe means that the output from the command specified before it will be used as input to the command specified after it |
| samtools | Call the samtools program |
| sort | Call the sorting algorithm implemented samtools |
| > | This redirects the output from the command specified before it into the file specified after it |
| mapped-reads/dpse2-to-dmel3R.bam | The output file for the mapped and sorted reads |
After this runs, we should get the file mapped-reads/dpse2-to-dmel3R.bam which contains the mapped reads in BAM format. SAM format is a text format
that contains one mapped read per line, along with information about the mapping and BAM is just the compressed version of SAM format.
samtools view is a helpful tool that let's us retrieve lines from these files and convert between formats. SAM files also contain headers that
tell us about how the file was generated and the reads that make up the file. Let's use samtools view to look at the header of our newly mapped reads.
First, let's change directories to the folder that contains the BAM file so we don't have to keep typing that in our commands:
cd mapped-reads| Command line parameter | Description |
|---|---|
| cd | The Linux change directory command |
| mapped-reads | The path to the directory we want to change to |
Now let's look at the header of our BAM file:
samtools view -H dpse2-to-dmel3R.bam| Command line parameter | Description |
|---|---|
| samtools | Call the samtools program |
| view | Use the view sub-program implemented within samtools |
| -H | Only output the header information of the input file |
| dpse2-to-dmel3R.bam | The input file |
| | | This pipe means that the output from the command specified before it will be used as input to the command specified after it |
head | The Linux head program which returns only the first few lines of an input file |
| -n 3 | Tells head to return only 3 lines of output |
The output should look something like this:
@HD     VN:1.6  SO:coordinate
@SQ     SN:3R   LN:32079331
@PG     ID:bwa  PN:bwa  VN:0.7.17-r1198-dirty   CL:bwa mem -t 4 dmel-3R-reference/Drosophila_melanogaster.BDGP6.28.dna.chromosome.3R.fa dpse-2-reads/illumina/pse-chr2_1.fastq.gz dpse-2-reads/illumina/pse-chr2_2.fastq.gz
@PG     ID:samtools     PN:samtools     PP:bwa  VN:1.10 CL:samtools sort
@PG     ID:samtools.1   PN:samtools     PP:samtools     VN:1.10 CL:samtools view -H dpse2-to-dmel3R.bam
The first line starting with @HD tells us the version of the SAM format that this file follows along with the sort order (SO of the file.
In this case, since we ran samtools sort, the sort order is coordinate.
Lines starting with @SQ tell us about the sequence names and lengths of the reference genome. These would be the sequence headers from the reference FASTA
file.
Finally, @PG tells us about the programs that were used to generate this file. These should look familiar!
Without the -H option, we can view the actual entries in the BAM file:
samtools view dpse2-to-dmel3R.bam | head -n 3| Command line parameter | Description |
|---|---|
| samtools | Call the samtools program |
view | Use the view sub-program implemented within samtools |
| dpse2-to-dmel3R.bam | The input file |
Now you should see some actual mapped reads!
SRR11230564.10809749 163 3R 33475 0 128S23M = 33475 23 GTAGACCCGACCGTTTTCCGGCCCAGATGACCTCCCCGATGCATAATATGTGCACCTGTCAACCAGAAGGTTCGTTTCTTAGGATTTCTATACTACAGTGCTGAGTAATTTTTCTCGCACTGTTTTTGGTAAAATAAAAAAAAAAAAAAAA <AAAFJFFJJJFJFFJJJJJJJJAFJJFFJFJFJJJJJJJJJJFFJJJJJJJJJJJAJFAJFJJJJFJJJFFFF7-7--7AA7JA<<AFJJJFJJJJFAFFFJJFAJJJAFFFJJJFJJJJJJJJJJJJJJJJJJJJJJJJJJJJJJJJJ- NM:i:0 MD:Z:23 MC:Z:128S23M AS:i:23 XS:i:23
SRR11230564.10809749 83 3R 33475 0 128S23M = 33475 -23 GTAGACCCGACCGTTTTCCGGCCCAGATGACCTCCCCGATGCATAATATGTGCACCTGTCAACCAGAAGGTTCGTTTCTTAGGATTTCTATACTACAGTGCTGAGTAATTTTTCTCGCACTGTTTTTGGTAAAATAAAAAAAAAAAAAAAC AF77)JJJJJJJJFJJAJJJJJJJJJFJJFJF<FJJJJJJJJJJJJFJJFJJFFJJJFJJJJJJJJFJJJJJJJJJJJJJJJFJJJJFJJJJJJJFJFJJJJJJJJJJJJJJJ<JJJJJJJJJJJJJJJJJJJJJJJJJJJJJJJJFFFAA NM:i:1 MD:Z:22A0 MC:Z:128S23M AS:i:22 XS:i:22
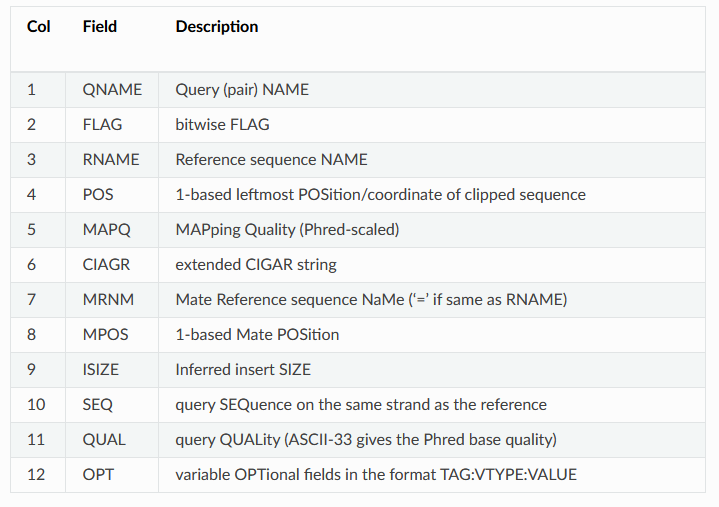
SRR11230564.16812502 99 3R 35215 0 55S20M76S = 35233 38 GAGAGACCAGGCCCATAAAAACCTAAAGACGAAACTCGGCCAGTACGGGCGGTAAGAGTACGAGTACGGGACCGATTATTACACTTAAATTGTAACCAATTTAACGGCACGTAAAAACTAAAAGCAGTCTCGGTGAGATCGGAAGAGCGTC AAFFFJJJJJJJJJJJJJJJJJJJJJJJJJJJJJJJJJJJJJJJJJJJJJJJFJJJJJJJJJJJJJJJJJJJJJJJFJJJJJJJJJJJJJJJJJJJJJJJJJJJJJJJJJJJJJJJJJJJJJJJJJJJJJJJJJJJJJJJJJFFJJJJJAA NM:i:0 MD:Z:20 MC:Z:71S20M60S AS:i:20 XS:i:20This is a tab delimited output with one read mapping per line. Some of the columns should look familiar, like the read name (column 1), sequence (column 10), and quality scores (column 11) from the FASTQ file. The other columns are described on the BWA website or in the table in this helpful walkthrough that I've copied below:
Duplicate reads can lead to spurious results for analyses that rely on depth of coverage, such as inferences of copy number variation. Depending on the sequencing machine used, the cause of duplicate reads can vary. For Illumina machines, duplicates can be caused by uneven PCR amplification (PCR duplicates) and a single spot on the flow cell being mistakenly identified as two separate spots (optical duplicates).
The best practice is to mark these duplicate reads in your final SAM/BAM file so that programs in later analyses can deal with them appropriately. To do this, we use the program Picard.
picard MarkDuplicates I=dpse2-to-dmel3R.bam O=dpse2-to-dmel3R.mkdup.bam VALIDATION_STRINGENCY=LENIENT M=dpse2-to-dmel3R-dupmets.txt CREATE_INDEX=true| Command line parameter | Description |
|---|---|
| picard | Call the picard program |
| MarkDuplicates | Use the MarkDuplicates sub-program implemented within picard |
| I=dpse2-to-dmel3R.bam | The input file |
| O=dpse2-to-dmel3R.mkdup.bam | The desired output file |
| VALIDATION_STRINGENCY=LENIENT | Tells picard not to exit if it encounters slightly different SAM formatting than expected |
| M=dpse2-to-dmel3R-dupmets.txt | The name for a file to output some metrics |
| CREATE_INDEX=true | Tells picard to also create and index file for the output BAM file. These indices are necessary for other programs to use the file. |
This should create a new BAM file, dpse2-to-dmel3R.mkdup.bam, as well as an index for this BAM file and a metrics file. In this file,
reads that have been determined to be duplicates will have 1024 added to their FLAG (column 2) in the
output BAM/SAM file. See this page for more info about SAM FLAGS.
We can get a summary of how many reads were marked as duplicates from the metrics file:
grep -a2 "## METRICS CLASS" dpse2-to-dmel3R-dupmets.txt| Command line parameter | Description |
|---|---|
| grep | The Linux pattern search command. Given a string and a file, grep
searches the file for the string and prints lines that contain matches to the screen. Can be used with regular expression pattern matching. |
| -a2 | Tells grep to also print the two lines after the match is found. |
| "## METRICS CLASS" | The pattern we want to search for. |
| dpse2-to-dmel3R-dupmets.txt | The file in which we want to search for the specified pattern. |
If the metrics file has been created succesfully, this should produce the following output:
## METRICS CLASS        picard.sam.DuplicationMetrics
LIBRARY UNPAIRED_READS_EXAMINED READ_PAIRS_EXAMINED     SECONDARY_OR_SUPPLEMENTARY_RDS  UNMAPPED_READS  UNPAIRED_READ_DUPLICATES        READ_PAIR_DUPLICATES    READ_PAIR_OPTICAL_DUPLICATES       PERCENT_DUPLICATION     ESTIMATED_LIBRARY_SIZE
Unknown Library 844     200412  2766    673346  134     621     0       0.003426        32272106
Based on the column headers, columns 6, 7, and 8 tell us how many duplicate reads were identified. In this case, 134 unpaired read duplicates, 621 paired read duplicats, and 0 optical duplicates were found, for a total of 134 + 621x2 = 1376 duplicate reads.
If we wanted to, we could look at these reads using samtools view and the flag 1024:
samtools view -f 1024 dpse2-to-dmel3R.mkdup.bam| Command line parameter | Description |
|---|---|
| samtools | Call the samtools program. |
| view | Use the view sub-program within samtools. |
| -f 1024 | Only look for lines that have this included in their FLAG column
(column 2). 1024 is the MarkDuplicates flag. |
| dpse2-to-dmel3R.mkdup.bam | The input BAM/SAM file to view. |
This should print all 1376 duplicate reads to the screen.
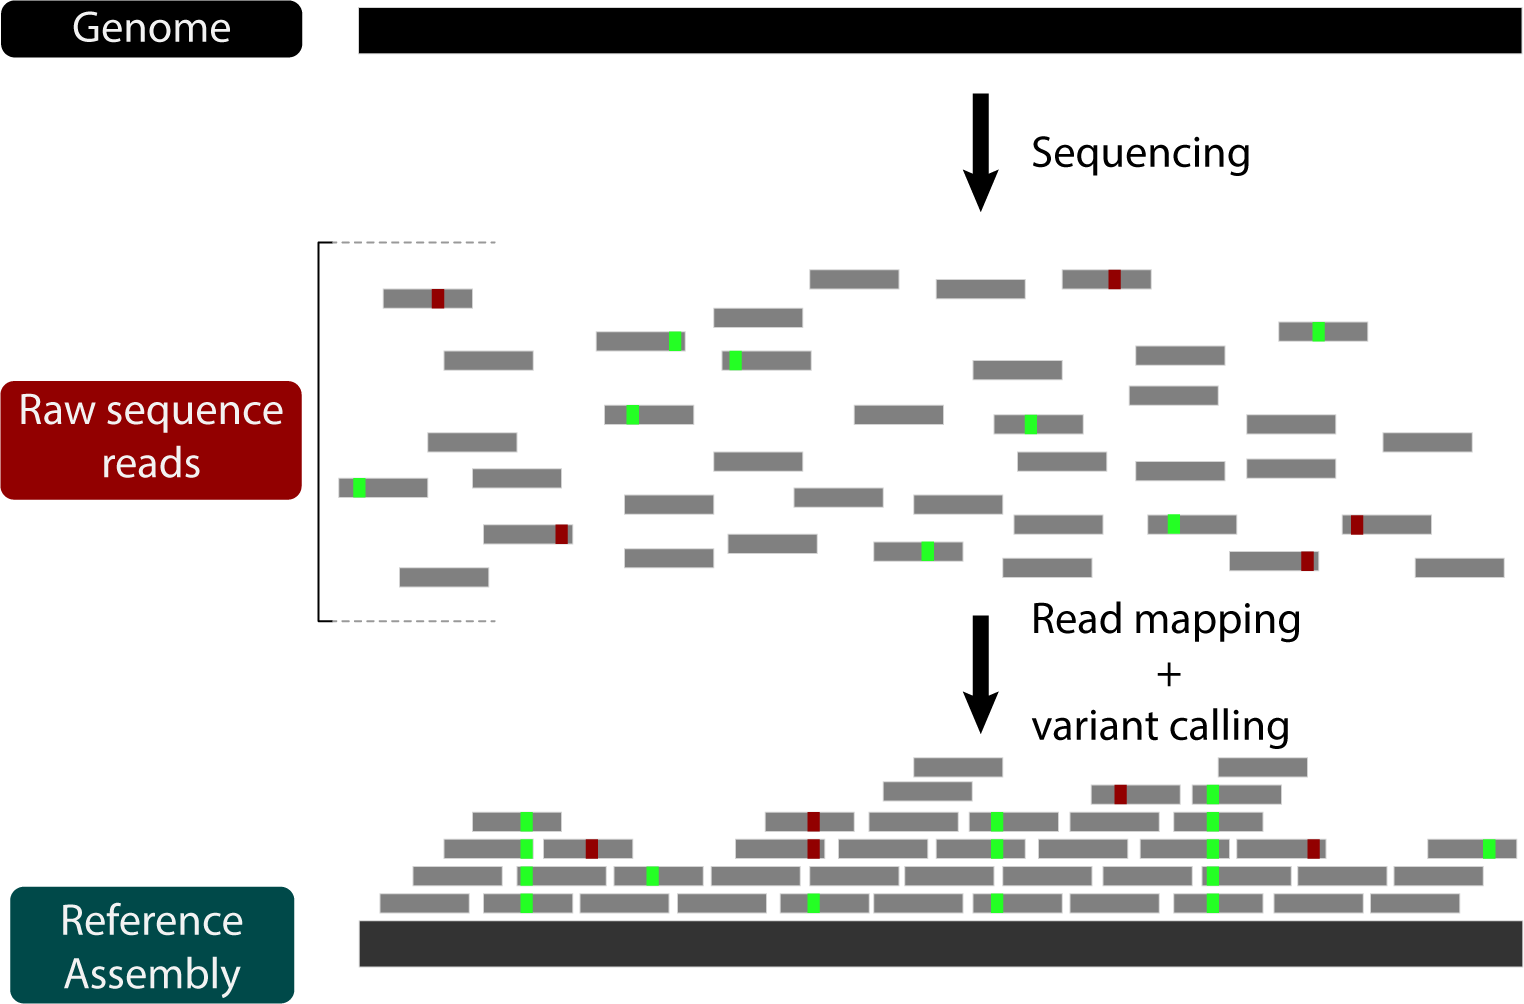
From here, the mapped reads can be used to calculate genotype likelihoods at each position to infer where the reference genome and the mapped genome differ. These variants can be used in downstream analyses to assess divergence, phylogenetic relationships, selection, or any other comparative analysis you can think of.
We won't cover this in detail today, but we've provided a list of several variant calling programs on the Programs page.
One of the most common questions you'll hear when mapping reads to a reference (or even during de novo assembly) is what is the average read depth? Read depth is simply defined as how many reads align to a given position in the reference genome and is related to the term coverage. However, when referring to coverage one is often asking how many reads it would take to cover X number of positions in the genome. With so many reads being produced by modern sequencing machines, the two terms have become interchangeable because it is assumed all positions in the genome will be covered by reads.
One way for estimating coverage is to use the Lander/Waterman (1988) equation:
\[ Coverage = \frac{LN}{G} \]
| Term | Definition |
|---|---|
Coverage | The number of times a position in the genome has been sequenced. The number of reads "covering" a position. |
L | Read length. |
N | Number of reads. |
G | Haploid genome length |
We can use this equation in two ways:
- Estimate read depth/coverage by solving as is.
- Estimate the number of reads needed to obtain a certain amount of coverage by solving for N.
In our case, for D. pseudoobscura chromosome 2, we know L, N, and G from
our fastqc analysis and genome assembly:
L | 150 |
N | 537507 * 2 |
G | 32000000 |
\[ Coverage = \frac{150 * 537507 * 2}{32000000} = 5.04 \]
So we estimate our coverage at 5.04, meaning that we would expect every position to be covered by 5 reads.
Let's see if this matches up to the observed read depth. First, lets use samtools depth to get the number
of reads that map to each position.
samtools depth dpse2-to-dmel3R.mkdup.bam > dpse2-to-dmel3R-depth.tab| Command line parameter | Description |
|---|---|
| samtools | Call the samtools program. |
| depth | Use the depth sub-program within samtools. |
| dpse2-to-dmel3R.mkdup.bam | The input BAM/SAM file. |
| > | This redirects the output that would have been printed to the screen to a file instead. |
| dpse2-to-dmel3R-depth.tab | The desired output file |
The dpse2-to-dmel3R-depth.tab file simply contains the position in the reference genome and the number of reads mapped to this position.
These files can get very large for large genomes, so its generally not adviseable to plot read depth per-base (as we're about to do). Instead, for larger genomes,
windows of 10kb to 100kb can be averaged and analyzed together. Another good program for calculating per-base read depth with some clever space-saving output
options is mosdepth.
But since we're looking at a small genome, let's just analyze this file! One of the pre-baked scripts provided is an R script that takes a
samtools depth file as input and calculates averge read depth and generates some figures. Let's run it on the file
we just created:
Rscript ../scripts/depth_plot.r dpse2-to-dmel3R-depth.tab| Command line parameter | Description |
|---|---|
| Rscript | Invokes R to run the script. |
| ../scripts/depth_plot.r | The path to the script. |
| dpse2-to-dmel3R-depth.tab | The input file. |
This script will take a couple of minutes to run, but should print the average read depth to the screen a histogram of read depth:
depth-hist.png, which you can look at by clicking on it in the file browser if you'd like. I see that average read depth is about 4:
# Avg. read depth: 3.948774This is lower than expected based on our calculation with the Lander/Waterman equation. Why? One cause would be many reads having sequencing errors leading to unmapped reads. This doesn't seem to be the case for our data, based on the FastQC results we obtained earlier. Another cause could be that the reads that contain the most variation between the two species were not able to be mapped. This is referred to as reference bias: reads that contain too much variation cannot be mapped, so the final mapped reads end up looking more like the reference genome than they actually are. Iterative mapping attempts to address this issue.