
One common format used to store biological sequence data is the FASTA format. Let's take a look at one of the reference sequences stored in FASTA format with the following command:
less -S dmel-3R-reference/Drosophila_melanogaster.BDGP6.28.dna.chromosome.3R.fa| Command line parameter | Description |
|---|---|
| less | A Linux text file viewer
(use <up arrow> and <down arrow> to scroll up and down by one line
or <space> and b
to scroll up and down by one page, resepectively. Type q to exit) |
| -S | Turn off line-wrapping within less
(use the <left arrow> and <right arrow> to scroll left and right). |
| dmel-3R-reference/Drosophila_melanogaster.BDGP6.28.dna.chromosome.3R.fa | The path to the file you want to view |
Here I've clipped the top of this output:
>3R dna:chromosome chromosome:BDGP6.28:3R:1:32079331:1 REF
ACGGGACCGAGTATAGTACCAGTACGCGACCAGTACGGGAGCAGTACGGAACCAATACGG
GTCCAGTACGGGTCCAGTACGGGTCCAGTACGGGTCCAGTACGGGACCAGTACGGGACCG
We can see that the first line begins with the greater than symbol (>). This indicates that it is a header line for the following sequence.
Header lines can contain whatever information the file creator thought would be important to annotate the sequence. In most cases, it will have a name
for the sequence and some information about its location in the genome.
After the header line comes the sequence. Sequences can be split up to multiple lines, but always form a single string that refers back to the previous header. There can also be multiple headers/sequences in a single FASTA file.
Reads require a different format because they are need to store another important piece of information regarding sequence data: per-base quality scores. To accomplish this, the FASTQ format is used. We can see an example of FASTQ format with the reads provided:
zless -S dpse-chr2-reads/illumina/pse-chr2_1.fastq.gz| Command line parameter | Description |
|---|---|
| zless | A Linux compressed text file viewer
(use <up arrow> and <down arrow> to scroll up and down by one line
or <space> and b
to scroll up and down by one page, resepectively. Type q to exit) |
| -S | Turn off line-wrapping within zless
(use the <left arrow> and <right arrow> to scroll left and right). |
| dpse-chr2-reads/illumina/pse-chr2_1.fastq.gz | The path to the file you want to view |
Here is what the first few lines of that file should look like:
@SRR11230564.32890235/1
TGATAATAAAACAACTTATTGCCCCCCTCTGGCAATACACTCTCCCGGTGTGGGGGGCCCTGACATGTAAAACGCAAATAAGAAGAATCCAGGGACAGCAGAACAAAATAATCAGAAATGCACTACTAGATCGGAAGAGCACACGTCTGAA
+
AAFFFJJJJJJJJJJJJJJJJJJJJJJJJJJJJJJJJJJJJJJJJJJJJJJJJJJJJJJJJJJJJJJJJJJJJJJJJJJJJJJJJJJJJJJJJJJJJJJJJJJJJJJJJJJJJJJJJJJJJJJJJJJJJJJJJJJJJJJJJJJJJJJJJJJ
@SRR11230564.32288433/1
ATTGTGTGTATGTTGTATTTTTCCCTAAGCACTTCATTTCTTGTGTAGCGTCCAGCTAGTAGTGCATTTCTGATTATTTTGTTCTGCTGTCCCTGGATTCTTCTTATTTGCGTTTTACATGTCAGGGCCCCCCACACCGGGAGATCGGAAG
+
AAFFFJJJJJJJJJJJJJJJJJJJJJJJJJJJJJJJJJJJJJJJJJJJJJJJJJJJJJJJJJJJJJJJJJJJJJJJJJJJJJJJJJJJJJJJJJJJFJJJJJJJJJJJJJJJJJJJJJJJFJJJJJJJJJJJJJJ<JJJJJAJJJJJJFJF
So as you can see there's a lot more information here. In FASTQ, lines that start with the @ character are the header lines and
can contain any amount of information about the sequence, including its ID, information about the sequencing machine that generated it, and whether
it is one of a pair of reads. In this case, since these reads were downloaded from the SRA, only an ID and the pair number (/1)
are included. In the snippet above there are two lines starting with @, meaning we are looking at information for two reads.
Following the header line are lines that contain sequences corresponding to that header, just like in FASTA formatted files. However, after this
is a line that starts with +. This is a linker line between the sequence and the quality scores. It can be left blank with just the
+ sign, or can contain header information as well.
After the linker line are the ASCII encoded Phred-scaled quality scores.
Sequencing machines read sequences as signals such as fluorescence or changes in pH or charge. Many sequencing machines can measure the intensity of these signals and other factors at run-time to assign the probabilty that the base called at each position is an error. These error probabilities are transformed into quality scores as follows:
\[ Q = -10\log P(error)\]
Scores resulting from this transformation are known as Phred scores because they were first used by the base-calling software Phred and usually range from 0 to 40.
To encode these scores into FASTQ files, they are converted to an ASCII character. Briefly, starting with the number 33, each character on an English keyboard has a corresponding integer code (called the decimal value or DEC). To convert Phred scores to ASCII characters, we first add 33 to the Phred score and look up that value in the ASCII table.
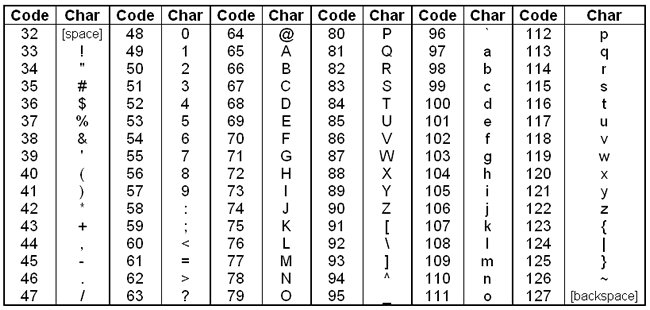
Converting from ASCII characters back to error probabilities is just the reverse of this process. For example, the first ASCII character in the quality strin
of the first read above is A. Looking this up in the table, A has a DEC value of 65. The corresponding Phred score would then be
65 - 33 = 32. And then we convert back to error probability with the reverse of the above equation:
\[ P(error) = 10^{-\frac{Q}{10}} \]
Using this equation, a score of 32 means the probability that this base is called erroneously is 0.00063
One of the first things one should do after receiving the sequence data (reads) is to assess their quality. This means acquiring some basic statistics, such as number of reads, average read length, average quality, etc.
Fortunately, since this is such a common task, there are programs out there that help. One of the most widely used is fastqc.
This program takes as input a set of reads in FASTQ format and generates an HTML file with several plots that can be viewed within a web browser.
Let's try to run fastqc on some of our short read (Illumina) data for D. pseudoobscura chromosome 2.
fastqc dpse-chr2-reads/illumina/pse-chr2_1.fastq.gz dpse-chr2-reads/illumina/pse-chr2_2.fastq.gz -o fastqc-output/| Command line parameter | Description |
|---|---|
| fastqc | Invoke the fastqc program. |
| dpse-chr2-reads/illumina/pse-chr2_1.fastq.gz | The first input read file. |
| dpse-chr2-reads/illumina/pse-chr2_2.fastq.gz | The second input read file. |
| -o fastqc-output/ | The -o option specifies the output directory. |
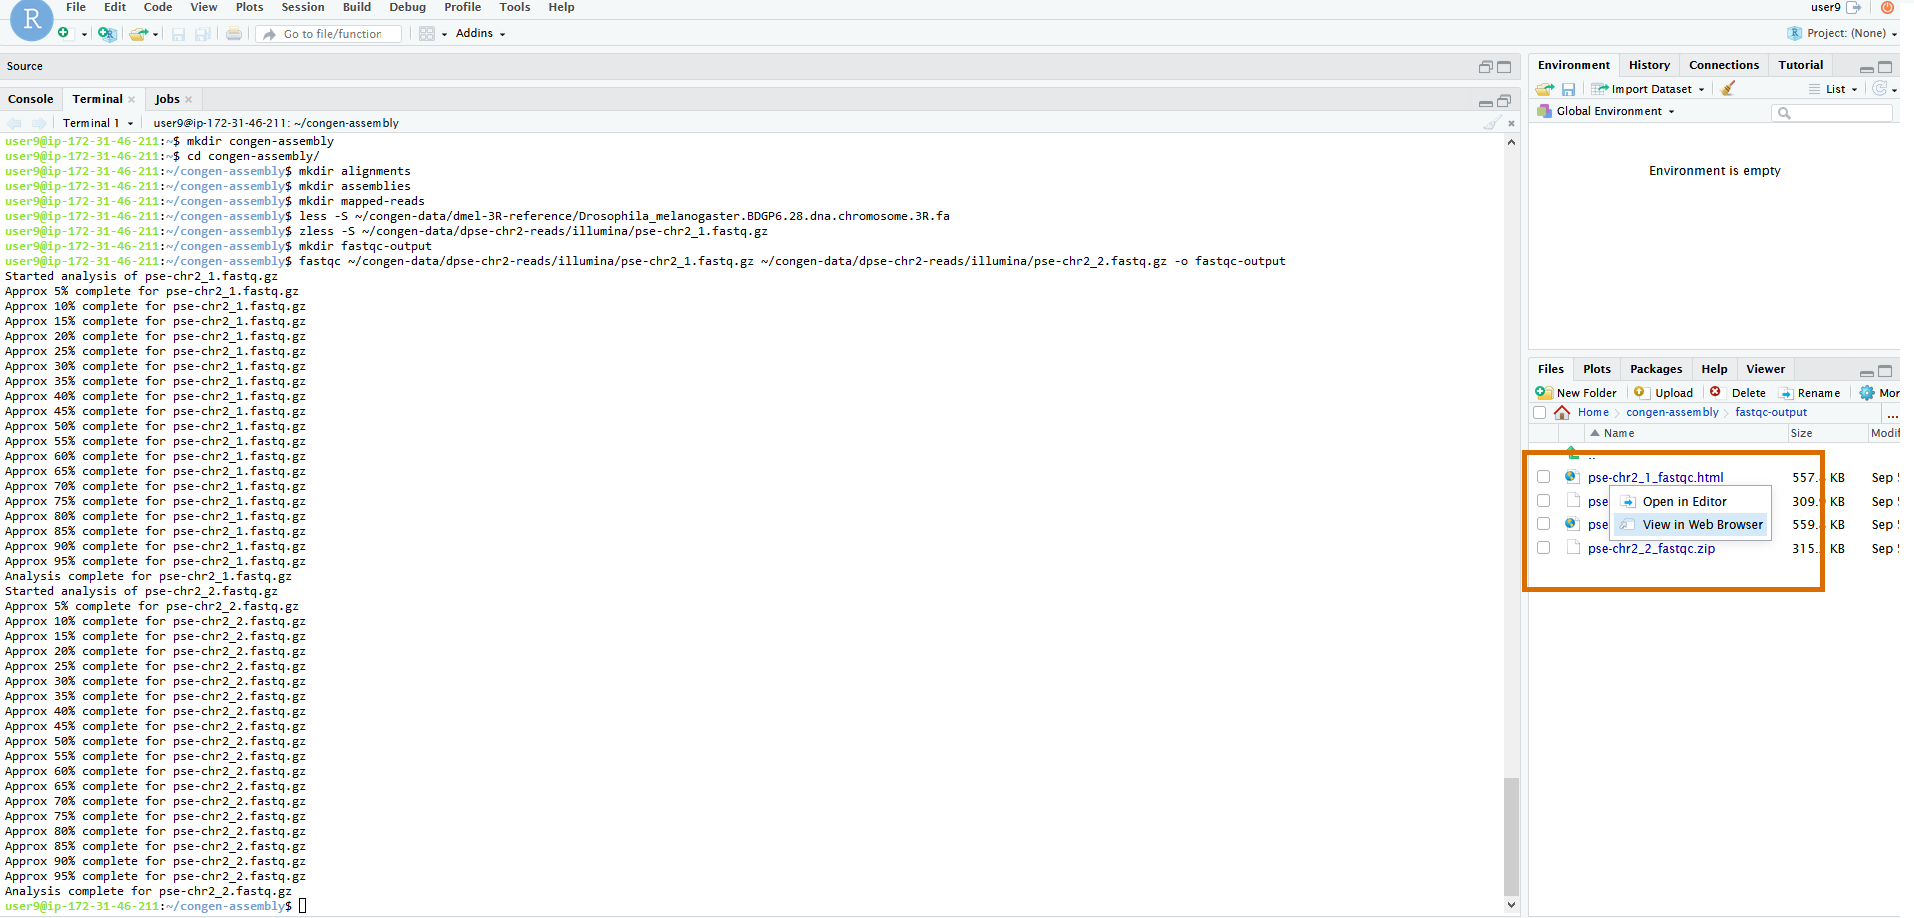
This should take less than a minute to run, during which you'll see some progress reported on the screen.
Unlike most of our other commands today, this won't output a text file that can be viewed easily from the terminal. Rather the HTML output should be viewed
in the browser. To do that, let's use the file browser on the right hand side of the screen to navigate with the mouse to
dpse-2-reads/illumina/fastqc-output/. Once you're there you should see 4 files, two .html files
and two .zip files. One file per type per input file. We can ignore the .zip for now. They contain
the raw output if we ever want to look at that ourselves. But FastQC helpfully summarizes it with the HTML files. Click on the file
pse-chr2_1_fastqc.html and then click on View in Web Browser to open the file in a new browswer tab.
The first time you select View in Web Browser you may get a warning that your browser does not allow pop-ups. There
should also be an option to allow pop-ups from this site. Click on that option and the file should open in a new tab. If not, click on the file and
select View in Web Browser again to open.
Once you have it open, the FastQC output should display a number of plots and summary statistics which can be scrolled through or navigated to with the links on the left.
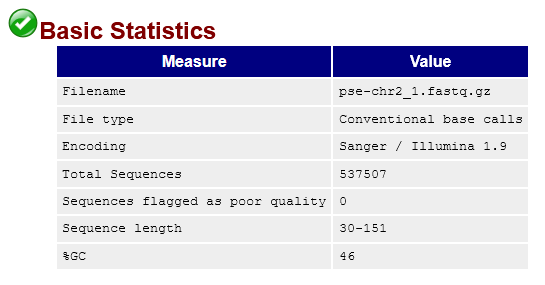
pse-chr2_1.fastq.gz.This tells us we've sequenced 537507 reads that range from 30-151bp long (though the vast majority are 150bp). It also tells us that none of the reads are considered low quality by FastQC. That's good! But let's take a look at the quality score distribution anyway:
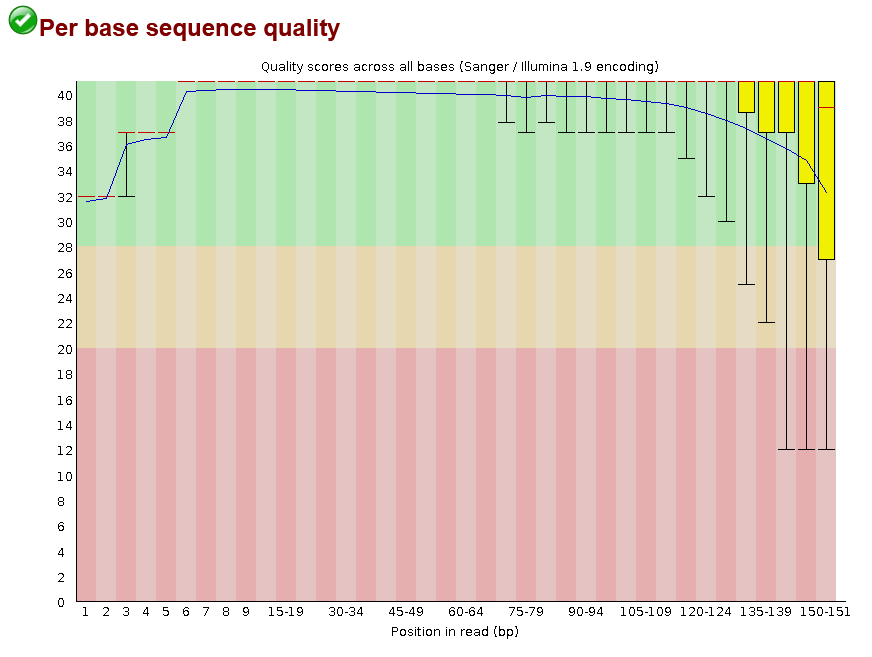
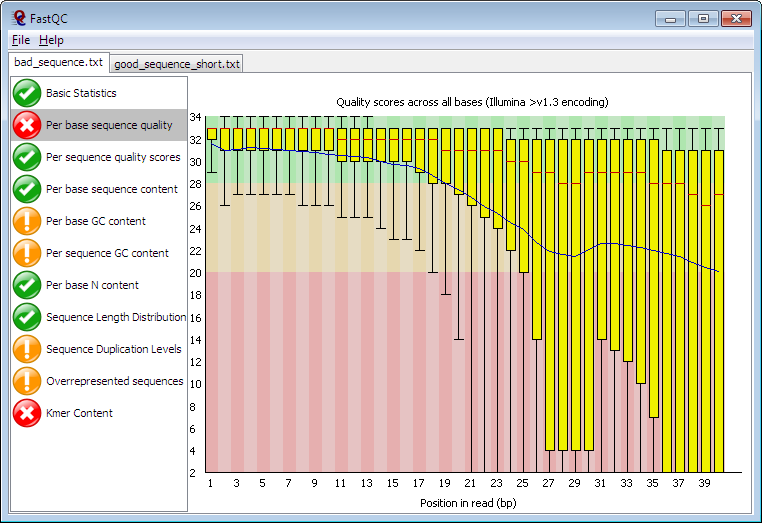
pse-chr2_1.fastq.gz.This shows that for most positions in most reads we have the highest quality score possible (40), with a bit of a drop-off towards the end of reads. This drop-off towards the end is usually caused by de-phasing. De-phasing happens because of the random nature of sequencing by synthesis. At any given spot on a flow-cell there may be thousands of cloned PCR fragments to be sequenced. During each cycle of the machine, nucleotides are washed over these spots and incorporated into the sequence -- but not in 100% of the fragments at a given spot. Just by chance, some sequences may not be extended in a given cycle, adding noise to the signal, which accumulates towards the ends of reads.
Despite this, I would still say this is high-quality data. Just to see, here is an example of poorer quality data from the FastQC homepage:
The only red flag in our reads is adapter content. Recall that adapters are the short sequences of nucleotides that allow the cloned DNA fragments to affix to the flowcell. Needless to say we wouldn't want to incorporate these sequences in our assemblies. Fortunately, most assemblers and read mappers trim these off automatically.
There are several pre-processing tasks you could perform to filter your reads, including:
- Trimming adapters
- Trimming low quality positions
- Decontamination
- Removal of duplicate reads
But in general, I allow the assembly and mapping programs to handle these tasks. The one exception being the marking of duplicate reads after read mapping, which is something we'll do in the Read mapping section. But for now, let's move on to Assembly...